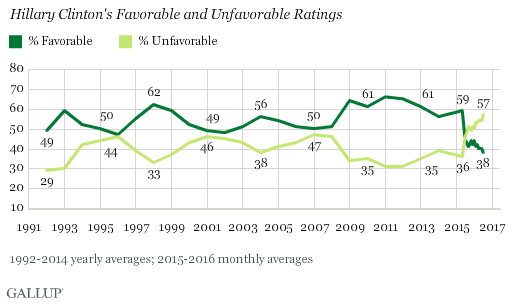
This is an easy blog to write, because the chart below, which shows Hillary Clinton’s unfavorability ratings (not favorability…that percentage is too low to feature) tells the tale:
Take a good look. Because those data are breathtaking.
Hillary Clinton declared for the presidency in April of 2015. At that time, she had a favorability rating of 59%, versus 36% unfavorable – a +23% spread. In fact, throughout the 25 years this tracking poll has been run, Ms. Clinton always had higher favorable ratings than unfavorable. No exceptions.
But now, after over a year of Ms. Clinton in the limelight, presenting herself to the voters…and largely being fawned upon/forgiven for every trespass by mainstream media…where are those ratings?
They are at 38% favorable and 57% unfavorable, a -19% spread.
That’s a drop of 42% in favorable/unfavorable ratings in little more than a year – a year during which Ms. Clinton did not hold office, thus could not have done anything wrong in office to affect those ratings. Hillary Clinton was just being Hillary Clinton.
Would it be fair to say that the more voters see of Ms. Clinton the less they like her?
I’d say so….